Industrial assets
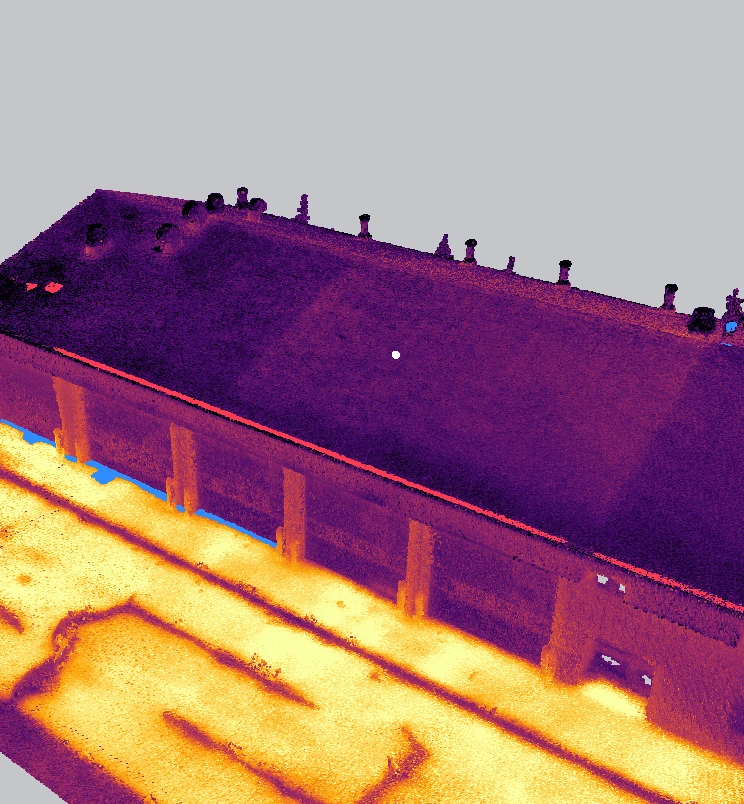
An example record of a pumpjack site. Pipework and equipment stay in 3D instead of flattening into a plan view, and the same review tools apply.

Our platform
Drone thermal imagery, processed into a measurable 3D thermal record of buildings and other assets.
Web viewer
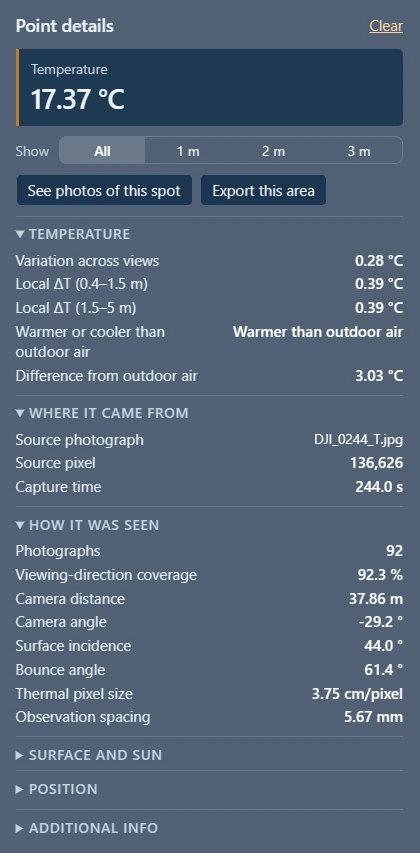
The 3D record over the site model. Click any point for its evidence, or colour the record by any field.
Tag points into asset areas and classes, such as roof, walls or equipment, to organize the review and leave out what isn't needed.
Step through each anomaly with the thermal and visible photographs that saw it, and mark it reviewed, deferred or excluded, with a note. Or skip that and open the draft report, where the anomalies are already narrowed down.
Export anomalies and areas as DXF outlines, or as E57 or LAS points, in the site's coordinates. The raw point cloud is delivered as LAZ.
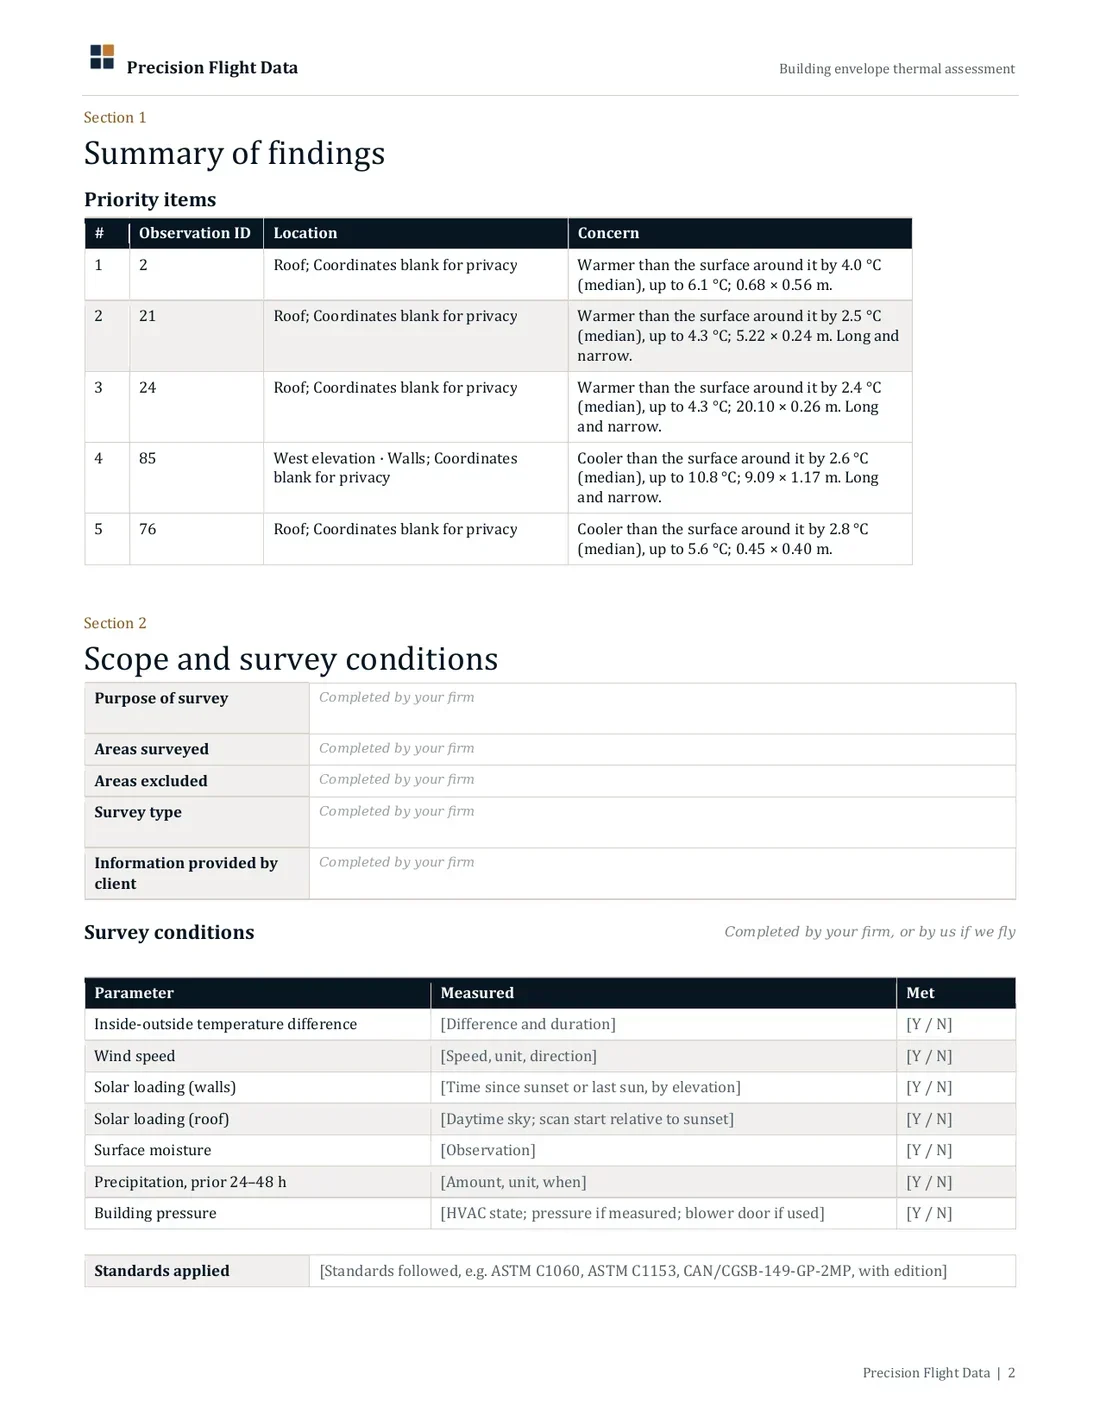
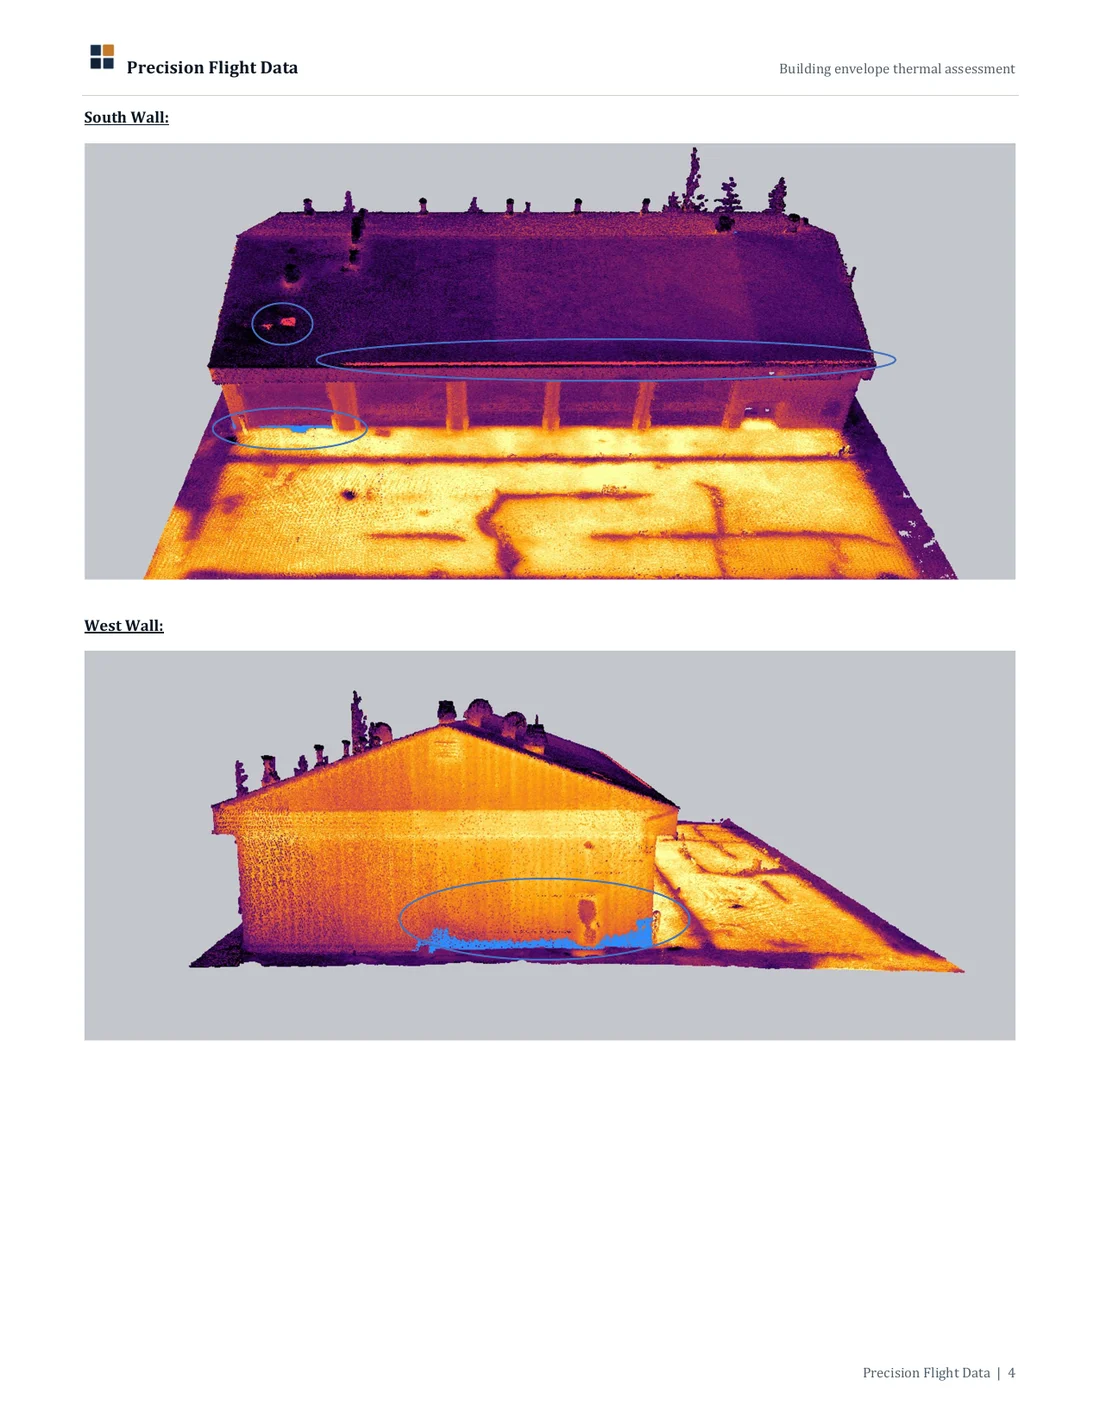
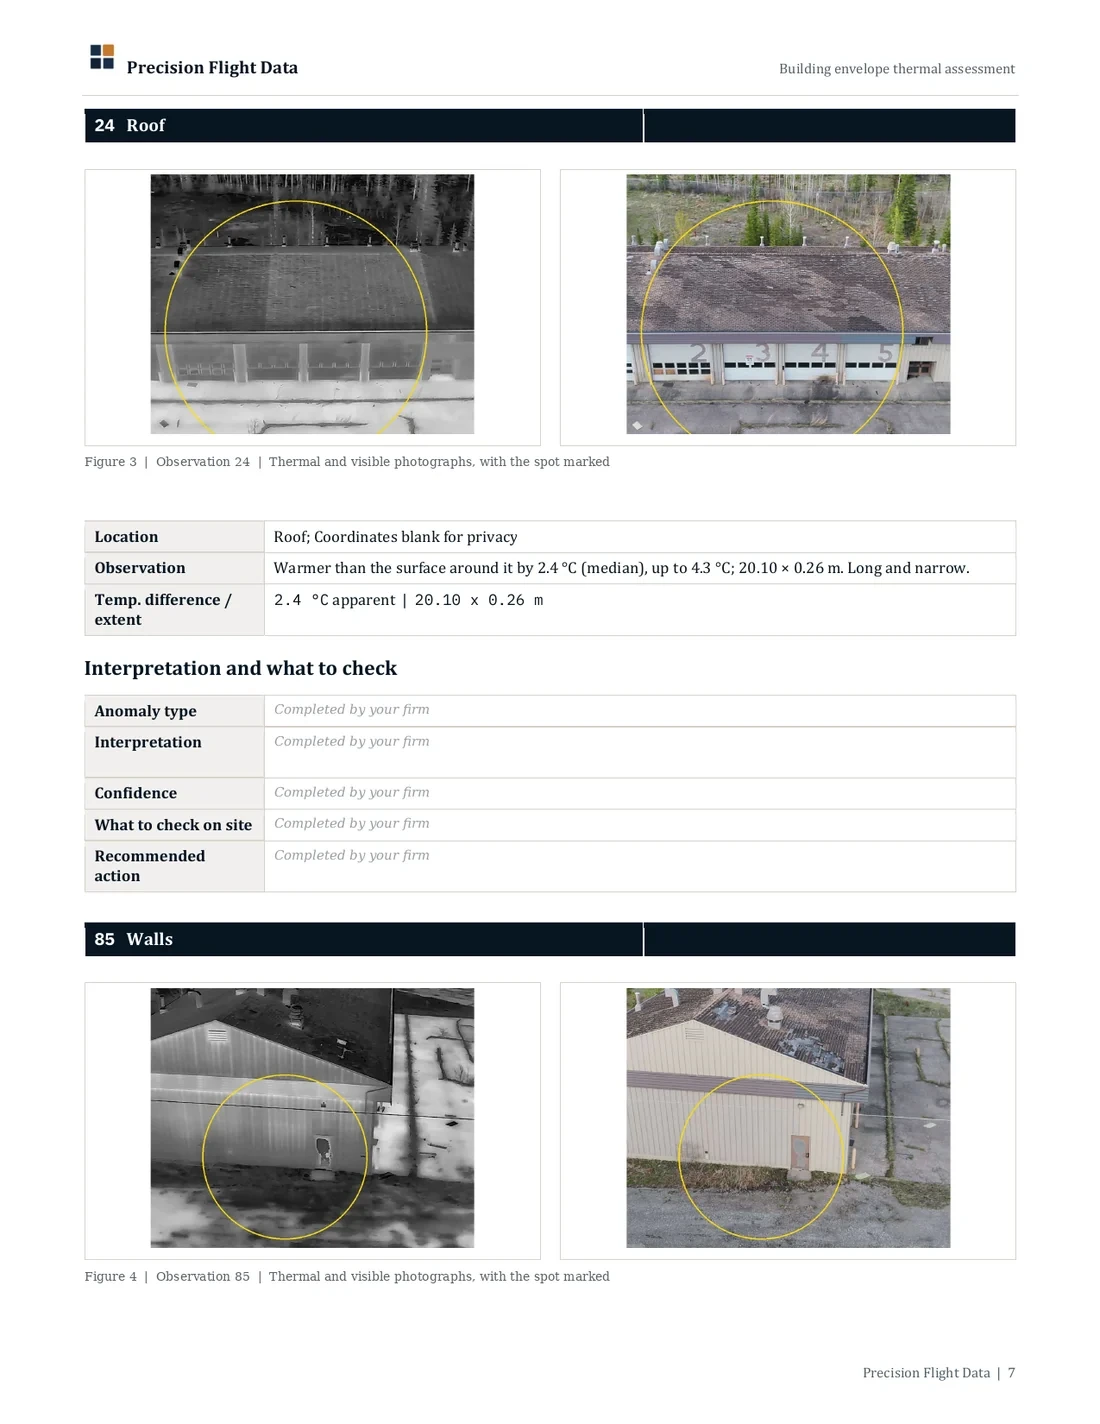
Interpretation and sign-off stay with your firm.
Other assets
An example record of a pumpjack site. Pipework and equipment stay in 3D instead of flattening into a plan view, and the same review tools apply.
An example record of a steel truss bridge. The deck, piers and truss stay in 3D too. I'd welcome your perspective on fit for the assets you review.
What is behind every point
Each field can colour or filter the record, or go into your own software.
Variation across views · Thermal pixel size · Photographs (count) · Viewing-direction coverage
Surface incidence angle · Surface tilt · Surface direction
Temperature · Local ΔT against surroundings · Difference from outdoor air · Sun incidence at capture · Potential solar exposure (minutes over 8 hours)
Capture time · Source photograph · Source pixel
2D and 3D
A thermal orthomosaic is a map of what faces up. On flat ground it is a fair record. On pipework and equipment, most of the surface faces sideways or down.
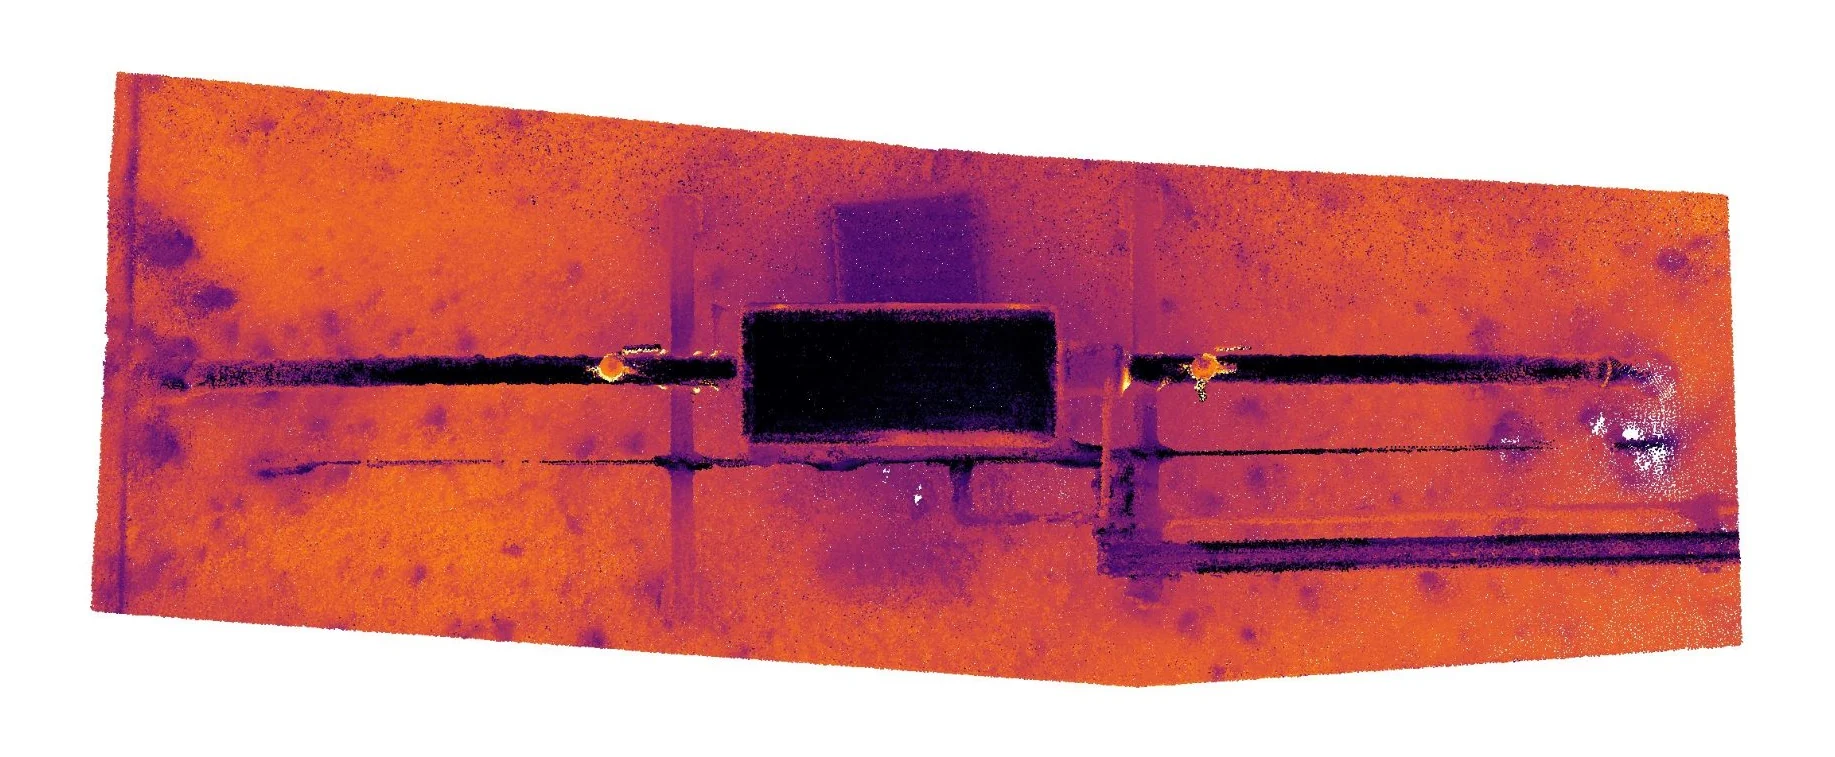 From above
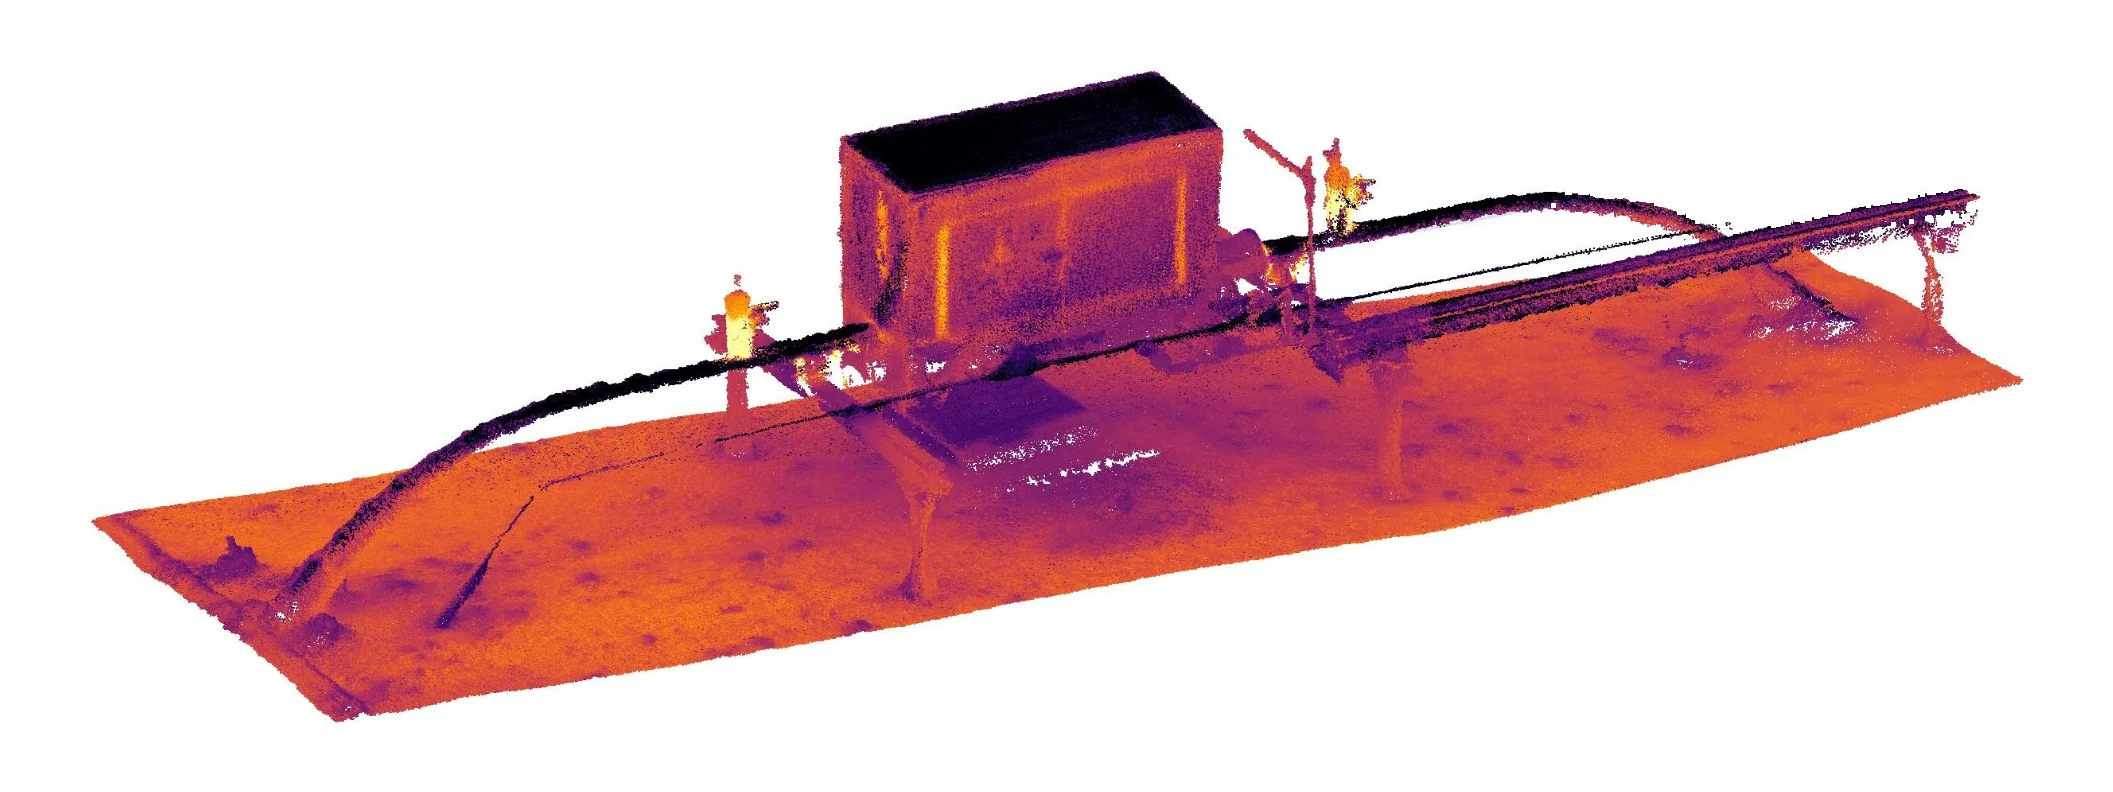 27.9 °C · 1,520.6 m elevation
A riser is a dot from above. In 3D its full height carries readings.
Hidden under the pipe in a top-down map, visible in 3D.
From above the enclosure is only a roof. In 3D its walls and fittings are read too.
Drone service providers and in-house drone teams
Your radiometric drone photographs become one 3D thermal record you can deliver to your clients. Your client relationship stays yours.
Radiometric photographs, as the camera wrote them.
That the capture is suitable, with guidance if it isn't.
A 3D thermal record in your client's coordinates, with reports.
The record and a hosted web viewer, with DXF, E57 and LAS exports.
Standoff calculator · Capture guide
Get in touchBefore you fly
Zenmuse H20T, Matrice 4TD and Matrice 4T. Other DJI radiometric payloads are expected to work but have not been through my processing yet, so ask me before you fly.
From receiving the photographs to a private link to the viewer and reports.
* Can vary with project complexity, and if travel is required.
Common questions
Focused investigation, repair planning and a record of the asset's condition at a known date. Each record carries its capture time and sits in the site's coordinates.
With a conversation about the building or assets you review and the work you have in mind. Capture suitability is assessed per project, including captures planned but not yet flown. If you don't fly, I can, or I can help you arrange it.
Capture quality and calibration stay with the team that flies, and I am glad to help with flight planning. My processing runs end to end, from radiometric captures to the 3D record in the viewer, and has been run on captures flown by other operators.
Next step
Tell me about the building and the survey you have in mind. I check that the capture is suitable, then scope and price a pilot before anything starts.